Market Starts 2025 On a Positive Note!
Grab your chai ☕︎! Let's dive into the weekly buzz of the Indian stock market.
Hello🙋♂️!
We are here with the 64th edition of ‘Sharpe Insights’.
This week was the first week of 2025 and the market started the year on a positive note. As mentioned in the previous edition, the market was oversold in the near term. So, this bounce was long due. However, the bounce was with low volumes on the stock level. So be a little more careful while deploying the funds.
And talking about starting 2025 positively, we at sharpely have done it too! We have added 2 new features in the strategy module in sharpely. Now, we have the most advanced rule-based strategy creator available to retail investors. You can learn more about it here.
We also did an AMA session with our founder on 28th December. In that, he answered questions from our users and talked about the roadmap for 2025. We are planning many exciting updates in 2025! You can watch the recording here.
Now let’s jump in and look at all the important data points of the week.
Global Macro Factors🌍
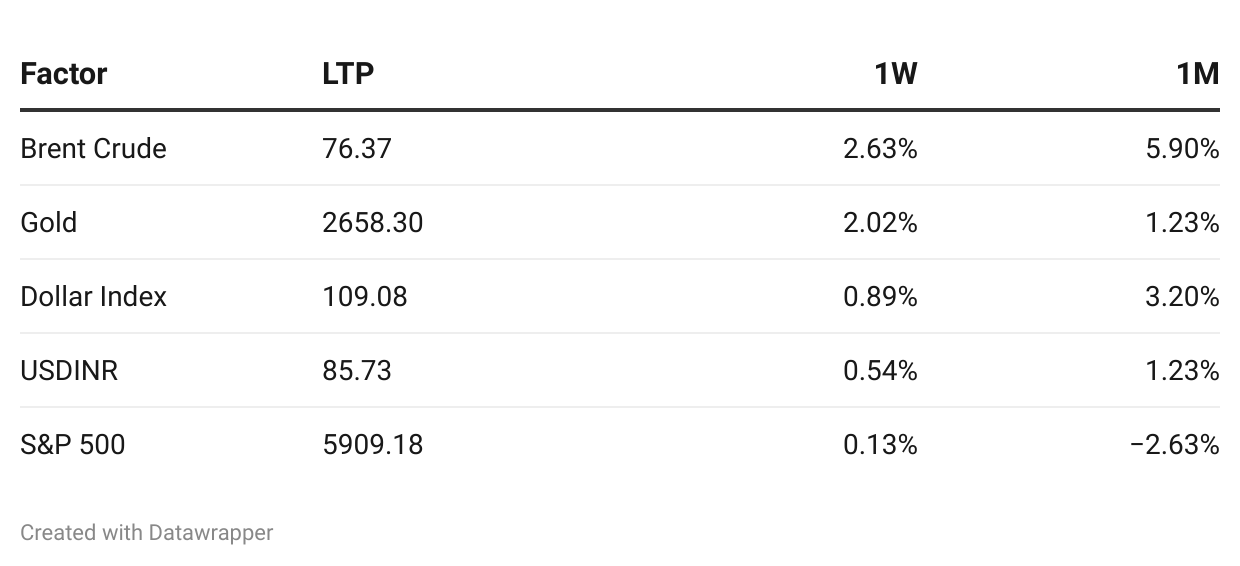
The global macro factors were mostly negative this week. Crude spiked by 2.63% this week. It is now trading above the $76 mark. Gold rallied by another 2.02% this week. It is now trading above the $2650 mark in spot price.
The dollar index was up by 0.89% and has crossed the 109 mark! The rupee was also down as USD INR increased by another 0.54% during the week. It is trading at a historical low of 85.73! The US 10-year Treasury Yield cooled off slightly. It is now at 4.57% vs 4.63% last week.
The S&P 500 was flat. It is now trading near the 5909 level! India's foreign exchange reserves dipped by $4.112 billion in the week to December 27 to $640.279 billion, data from the Reserve Bank of India showed.
Market Performance📈
This week, we saw a bounceback in the market. All the broader market indices ended the week in green with decent gains. The advance-decline numbers were also solid, as 60-80% of the stocks (across various market caps) closed the week with gains.
This week’s bounce was on the back of positive Q3 business updates. The quarterly result season is about to begin and it is a very important one. This is because it will decide the market’s direction in the coming weeks.
The Nifty 50 was up by 0.80%. The Nifty 100 and Nifty 500 also rallied by 1.01% and 1.17% respectively. While the Nifty Smallcap 100 was up by 1.48%, the Nifty Midcap 100 was the top gainer and ended the week with an impressive move of 1.67%!
Now, let’s talk about the stocks. ONGC was the top gainer among Nifty 50 names with a gain of 9.28%. DMart was the top gainer among Nifty 100 stocks, with weekly gains of 12.43%. ITI topped the gainers’ chart among Nifty 500 and Smallcapcap 100 names. IREDA was the top gainer among Nifty Midcap 100 names, increasing by 16.53% this week.
Sector Analysis📊
This week, we had a mixed bag at the sectoral level. Apart from Realty and BFSI, almost all sectoral indices ended in the flat to positive territory.
PSE, FMCG and Auto outperformed on the back of positive Q3 business updates.
Nifty Auto was the top gainer of the week with an impressive rally of 3.92%. Many auto companies reported solid Q3 updates with double-digit QoQ growth and the market cheered the news. The same was the case with FMCG stocks.
Now, let’s discuss market breadth. We gauge it by looking at stocks trading above their 50-day EMA. The number bounced strongly this week. It is at 40.80% vs 31.80% last week. even after the bounceback, this number is near 40%. So, if we see strong Q3 numbers, we can bounce back further from here (we are repeating this).
Sectors To Watch
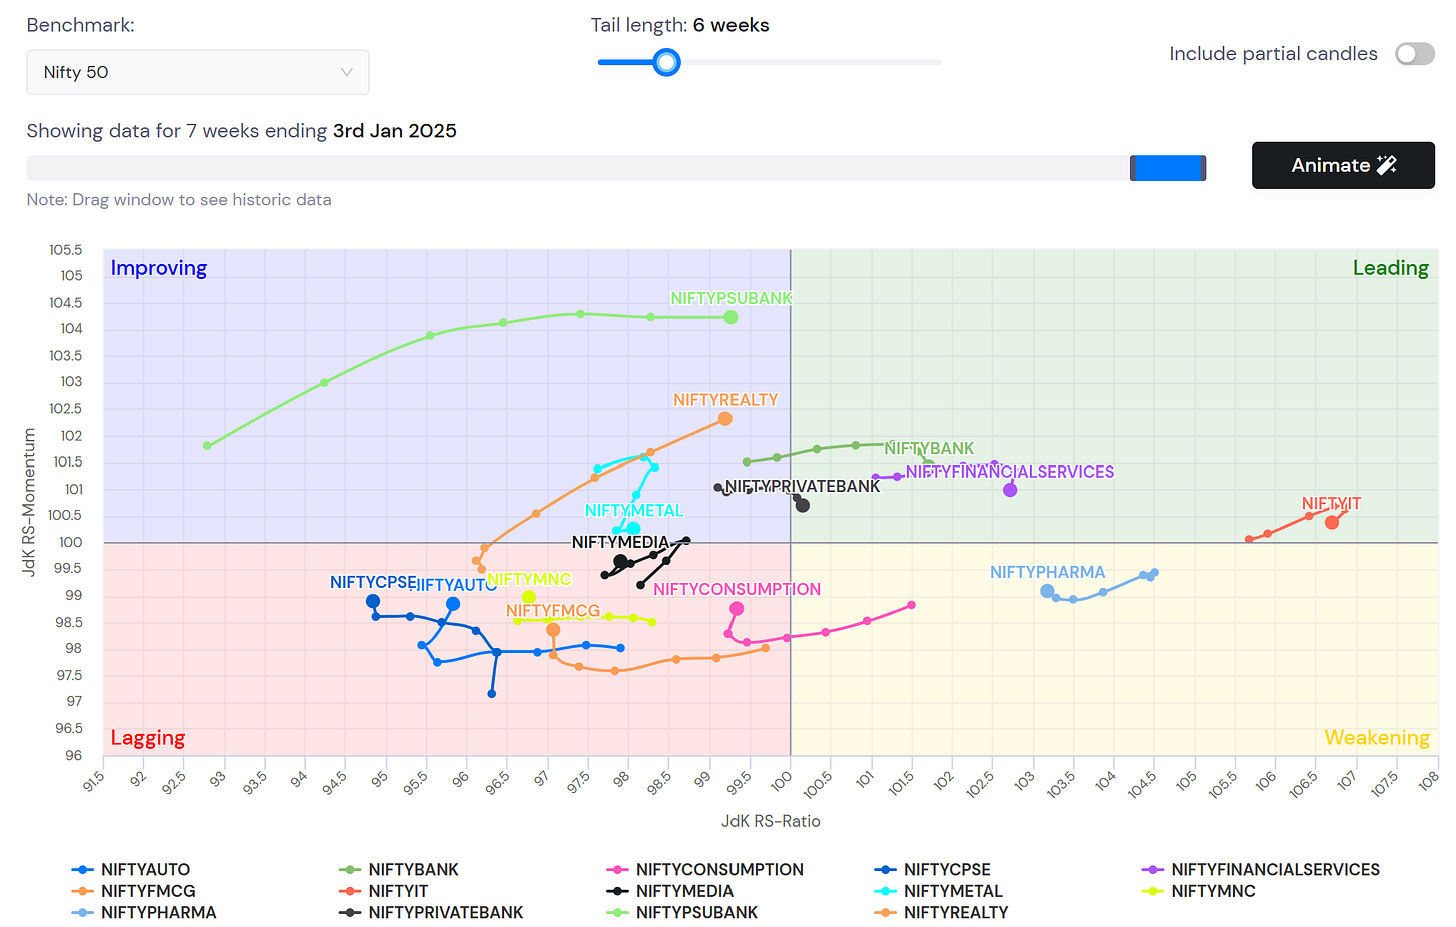
Many premium members are using RRG charts on sharpely. It helps you to find strong sectors and stocks based on relative strength and momentum. You can check it out here. Now, let’s see what it says this week.
Similar to last week, we can see that many sectors are in the lagging quadrant (red one). But there are some interesting names on the strong side of the chart. Keep an eye on Banking and Finance, Realty, and IT space. IT stocks will be the first ones to react as they report their quarterly numbers early.
On the RRG chart, you can also compare stocks from these sectors to find the strong ones! Finding the right sectors and stocks can’t be more easy than this! So check this tool out now!
That’s it for this week, folks. See you next Sunday!


