


Three Green Days!
Grab your chai ☕︎! Let's dive into the weekly buzz of the Indian stock market.

Hello🙋♂️!
We are here with the 75th edition of ‘Sharpe Insights.’

This week was shortened due to two market holidays. So we had only three trading days. However, during all three days, bulls showed strength. FIIs were net buyers in the cash market on all three days.
Apart from that, the Q4 results season has started, and many big names have announced their results. So far, we are seeing a clear trend in the market. IT names are reporting weaker-than-expected numbers, and BFSI companies are reporting strong numbers. We post result-related updates on our X account. Don’t forget to follow us so that you don’t miss any important updates.
Next week, many companies will announce their results. You can find the complete list in our event calendar.
In the last couple of weeks, we also saw the fallout of Gensol Engineering. We have written a detailed article on it with all the important events and red flags. You can read it here.
We have a lot to uncover this week. So, without wasting any time, let’s dive in!
Global Macro Factors🌍
The global macro factors were mostly positive this week. Crude oil spiked after a solid fall in the last month, and it is now trading near the $67.5.5 mark. Gold continued its upward journey this week as it rallied by another 5.90%. This is an unprecedented rally in the yellow metal. It is now trading at an ATH level of $3341.30!

The dollar index fell and is currently hovering near the 99 mark. The rupee moved up decently as USD INR fell by a solid 0.91% during the week. The US 10-year Treasury Yield also fell this week. It is now at 4.33% vs 4.49% last week.
The S&P 500 was marginally up. Now, it is trading near the 5280 level. On the domestic front, India's forex reserves increased by $1.567 billion to $677.835 billion for the week ended April 11, the Reserve Bank said on Friday. This is the sixth week of gains in our forex reserves.
Market Performance📈
As mentioned earlier, this was the week of bulls. All the key broader market indices ended the week in the green. And all of them rallied 4% or more!
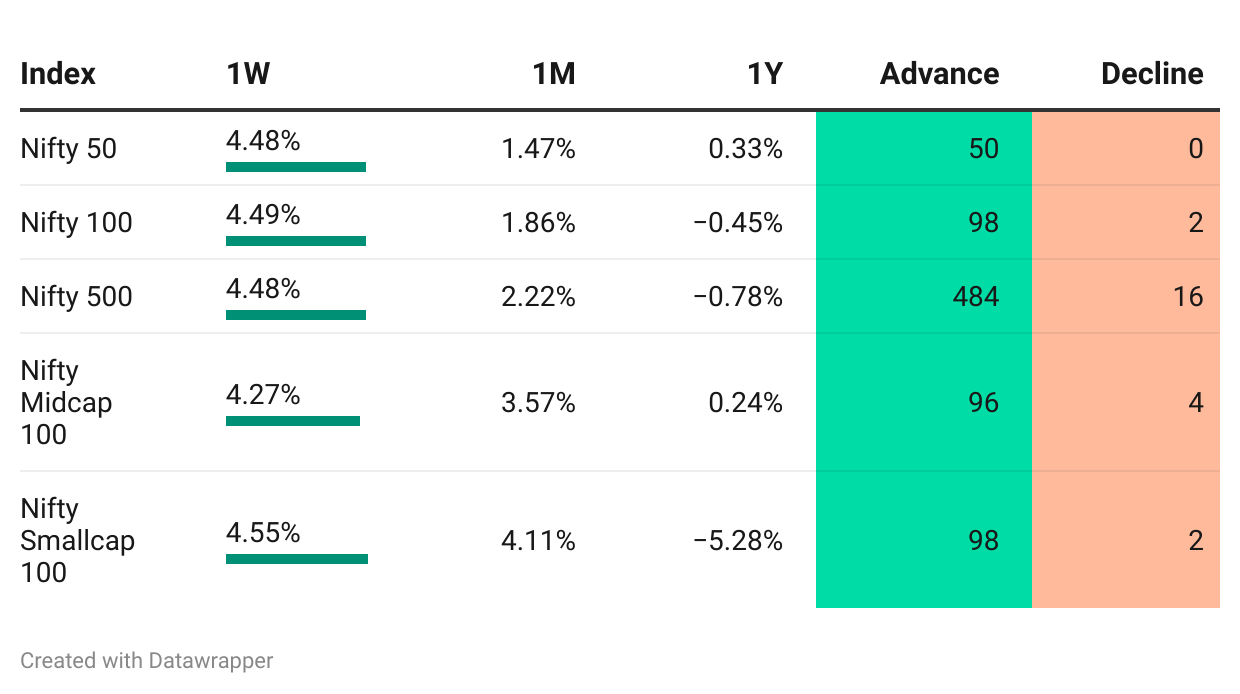
The Nifty 50 was up by 4.48% during the week. The Nifty 100 was up by 4.49%. Nifty 500 increased by 4.48%. While the Nifty Midcap 100 was up by 4.27% this week, the Nifty Smallcap 100 ended the week with gains of 4.55 % and was the top gainer of the week. Market breadth was also strong, as 90 to 95% of stocks across indices ended the week in green.
If we talk about stocks, Indusind Bank was the top gainer among the Nifty 50 and Nifty 100 names with a weekly move of 17.12%. FACT and Dixon topped the chart among Nifty 500 and Nifty Midcap 100 names as they rallied by 27.48% and 15.36% this week. JBM Auto was the top gainer in the Nifty Smallcap 100 names.
Sector Analysis📊
This week, we saw a broader bounce on the sectoral level as well. All the sectoral indices ended the week in the green. Twelve indices ended the week with gains of at least 3%.

Nifty Realty was the week’s top gainer as it spiked by 6.95%. Nifty Bank was second, with an up move of 6.45%. Nifty Bank also gave an ATH close in the weekly timeframe. Nifty Finance completed the top three. Apart from these, PSU banks and Services stocks also did well.
Now, let’s discuss market breadth. We gauge it by looking at the percentage of Nifty 500 stocks trading above their 50-day EMA. This week, we saw a continuation of the bounce. Last week, this number was 40.40%. This week, the number jumped to 64.60%. We believe anything between 30 and 70% is healthy for the market. So, the market breadth looks healthy at the moment.
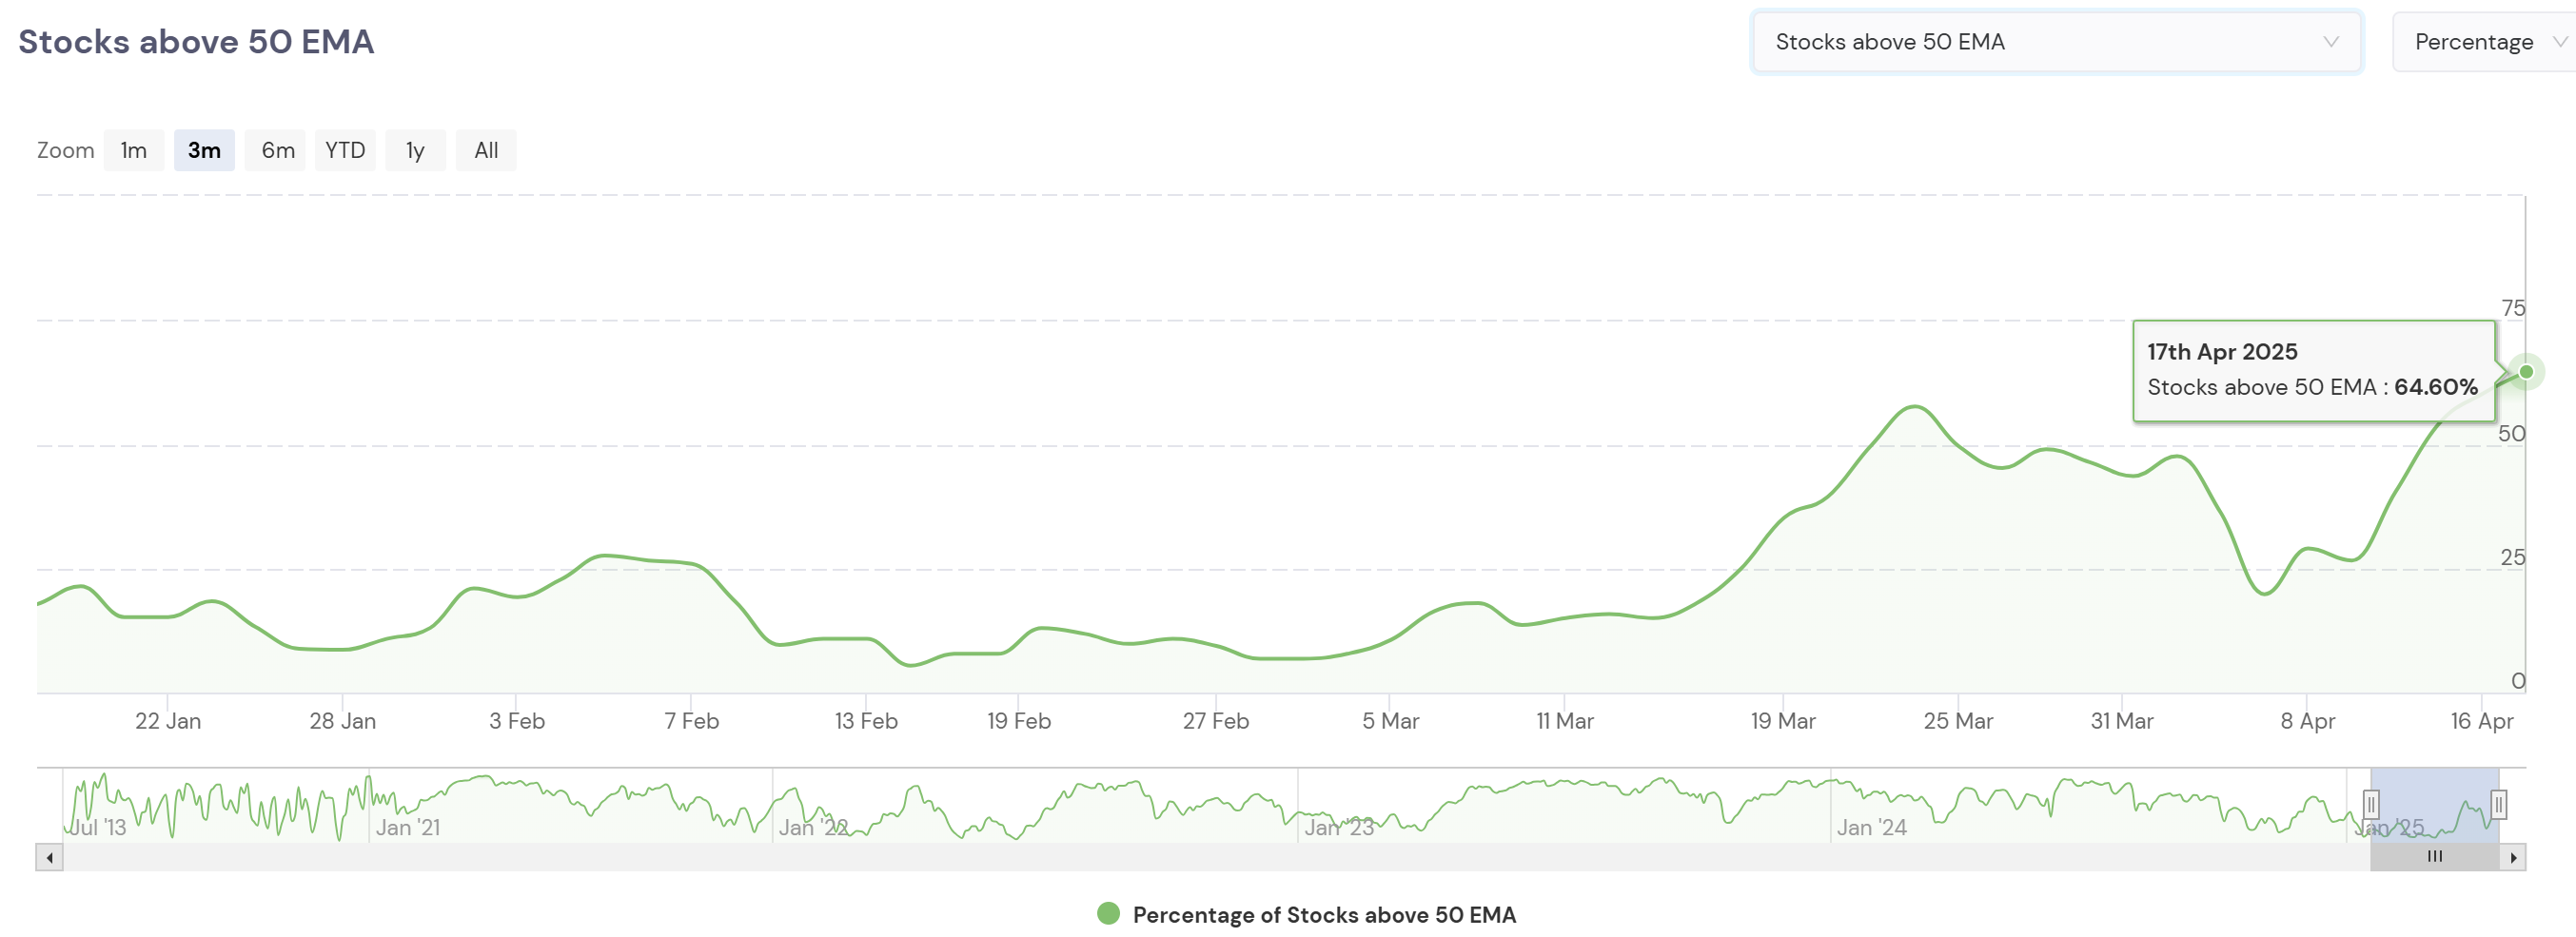
Does this mean the bad days we will see a rally of the same magnitude as the fall? We don’t think saw. After a price correction like the current one, we generally see a time correction. During this time market goes up and down (and frustrates the investors). But during this time you should deploy the capital in tranches to generate alpha during the next rally.
Sectors To Watch
First things first. We have made a much-requested update on the RRG chart. You can read about it here.
Many premium members are using RRG charts on sharpely. It helps you to find strong sectors and stocks based on relative strength and momentum. You can check it out here. Now, let’s see what it says this week.

We can see that many sectors are between the lagging and improving quadrants (red and purple ones). But some are firmly in the leading quadrant on the right side. Keep an eye on Banking and finance stocks (both public and private). They are showing high relative strength and momentum. Oil & Gas and PSE names (especially some defence stocks) are also looking good. On the other hand, IT, Healthcare and Auto are looking weak at the moment.
On the RRG chart, you can also compare stocks from these sectors to find the strong ones! Finding the right sectors and stocks can’t be easier than this! So check this tool out now!
That’s it for this week, folks. See you next Sunday!